
One of the most important aspects of technical analysis is identifying areas where risk and reward can potentially become favorable. These are the zones where market participants should pay close attention, not because they guarantee a reversal, but because they often provide valuable insights into future price direction.
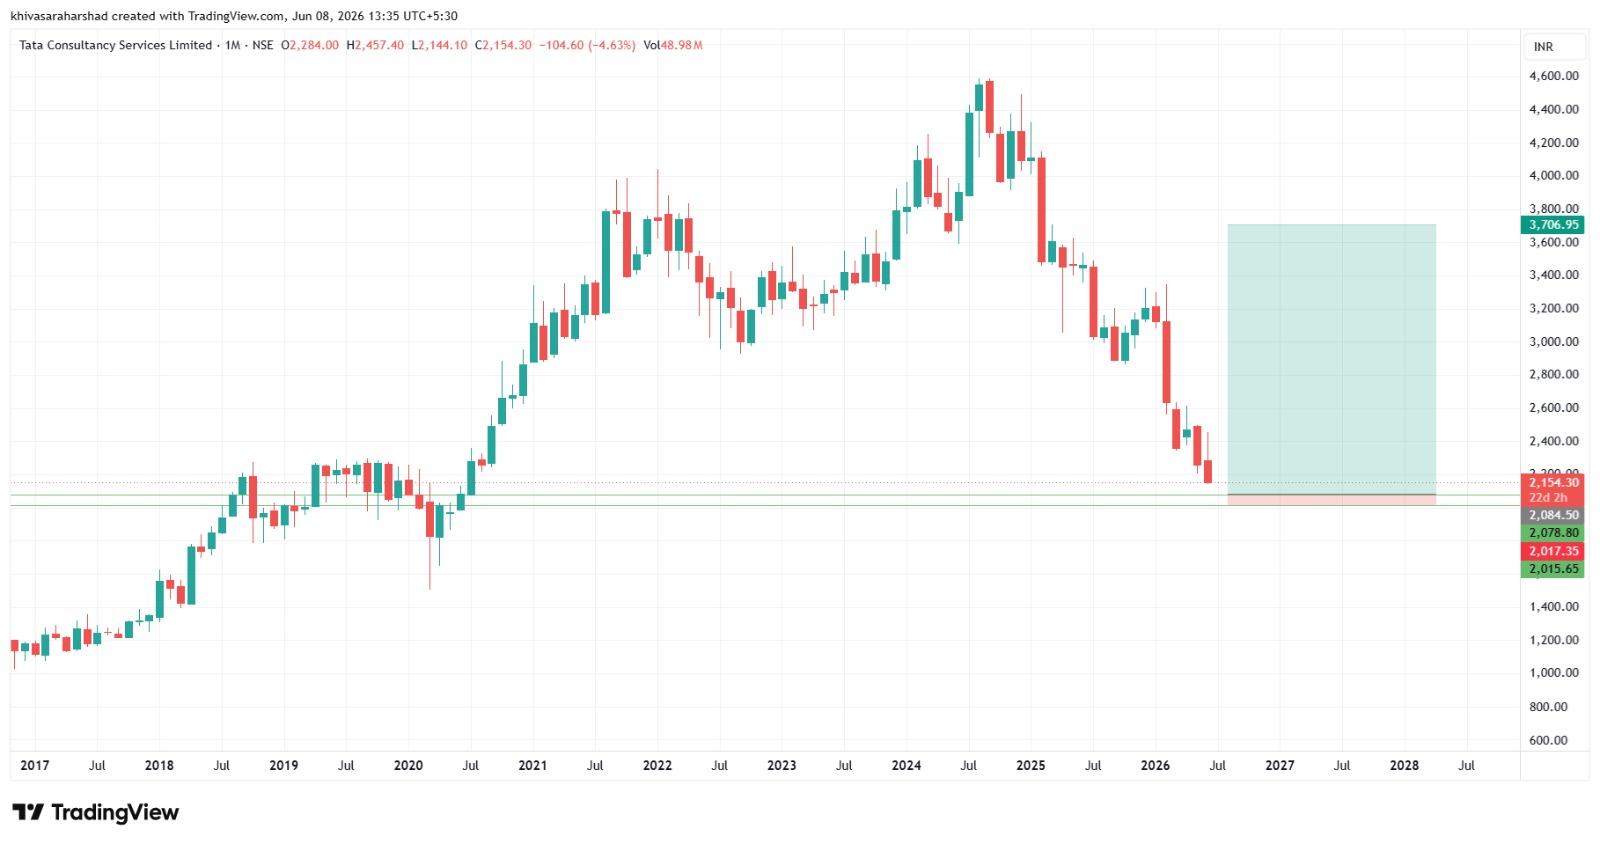
Looking at the monthly chart of TCS, the stock has undergone a significant correction from its peak and is now approaching the ₹2,000–₹2,100 region. This area stands out as an important long-term support zone that has historically attracted buying interest.
Why This Zone Matters
The current price region is not just a random number on the chart. It represents an area where the market previously spent considerable time consolidating before beginning a strong upward move. Such zones often act as important reference points for institutional participants and long-term investors.
As price revisits this area after several years, market participants will closely monitor whether demand emerges once again.
What the Chart Is Telling Us
A few observations from the monthly timeframe:
- The stock has corrected substantially from its all-time high.
- Price is approaching a historically significant support area.
- The current zone aligns with a previous accumulation and breakout region.
- Long-term trend participants are likely to monitor this level for signs of strength or weakness.
At this stage, the chart does not confirm a reversal. However, it does indicate that TCS has entered a region where the market’s reaction could provide important clues regarding its future direction.
What I Will Be Watching
Rather than trying to predict the exact bottom, my focus remains on observing how price behaves around this support zone.
Some key factors I will monitor include:
- Evidence of buying interest near support.
- Monthly candle structure and closing behavior.
- Increase in participation through volume.
- Development of higher highs and higher lows after stabilization.
These factors can help determine whether the support zone is attracting genuine demand or whether further downside remains possible.
Final Thoughts
Markets reward patience more often than prediction. While many investors focus on chasing momentum, some of the most attractive opportunities emerge when quality businesses experience prolonged periods of pessimism.
TCS has now reached a technically important area that deserves attention. Whether it becomes the foundation for the next major move or merely a temporary pause in the correction is something only time and price action will reveal.
For now, the chart is sending a simple message: Observe carefully, remain objective, and let the market provide confirmation before forming strong conclusions.
Disclaimer: This article is intended solely for educational and research purposes. It should not be considered investment advice. Investors should conduct their own research and consult qualified financial professionals before making investment decisions.